
Vol. 15, No. 4 / The Demographic Profiles of U.S., Gulf States and Mississippi Seafood Processing Workers and Owners
March 25, 2025
ABSTRACT
- This newsletter summarizes the changes in the demographic profiles of seafood processing workers and owners of the U.S., Gulf of America States, and Mississippi seafood processing industry.
- Demographic profiles include distribution by gender, race or ethnic origin, and age group. The U.S. demographics were compiled in 2016, 2020, and 2024, while the demographics of the entire U.S., the Gulf region, and Mississippi were compiled in 2024.
- In 2022, seafood processing contributed $17.4 billion to the entire U.S. economy, $1.5 billion to the Gulf regional economy, and $108 million to the Mississippi state economy.
- The seafood processing industry generated 127,000 jobs for the entire U.S. economy, 12,700 jobs for the Gulf region, and 1,450 jobs for Mississippi.
KEYWORDS
- Seafood processing plants; Seafood product preparation and packaging
METHODS
- Seafood Product Preparation and Packaging is represented by NAICS (https://www.census.gov/naics/) code 3117.
- This industry comprises establishments primarily engaged in one or more of the following: (1) canning seafood (including soup); (2) smoking, salting, and drying seafood; (3) eviscerating fresh fish by removing heads, fins, scales, bones, and entrails; (4) shucking and packing fresh shellfish; (5) processing marine fats and oils; and (6) freezing seafood.
- Establishments known as "floating factory ships" that gather and process seafood into canned seafood products are included in this industry.
- The data on the demographics of the seafood processing were compiled from Lightcast (https://lightcast.io/).
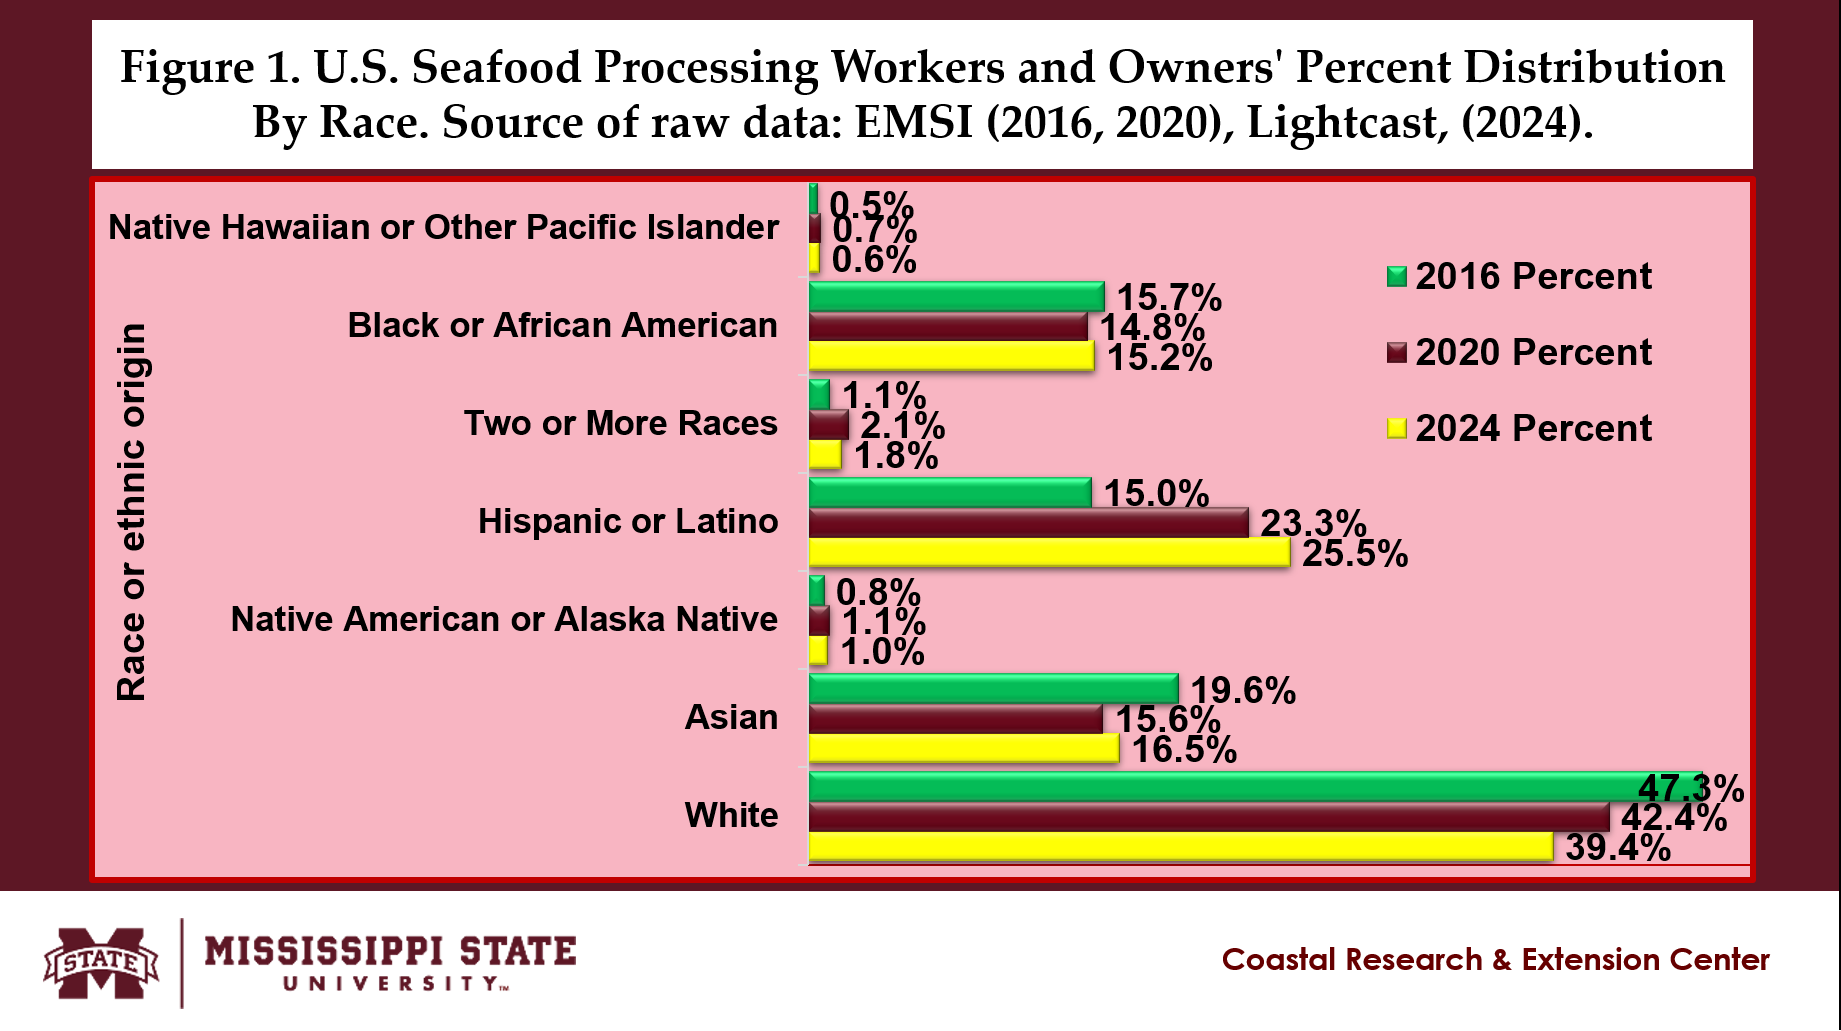
RACIAL OR ETHNICITY BREAKDOWN OF U.S. SEAFOOD PROCESSING WORKERS AND OWNERS
- White workers and owners fell from 47.3% in 2016 to 42.4% in 2020 and 39.4% in 2024 (Fig. 1).
- Asian workers and owners declined from 19.6% in 2016 to 15.6% in 2020 and 16.5% in 2024.
- Native American or Alaska Native workers and owners increased from 0.8% in 2016 to 1.1% in 2020 and 1.0% in 2024.
- Hispanic or Latino workers and owners increased from 15.0% in 2016 to 23.3% in 2020 and 25.5% in 2024.
- Workers and owners who reported two or more races increased from 1.1% in 2016 to 2.1% in 2020 and 1.1% in 2024.
- Black or African American workers and owners fell from 15.7% in 2016 to 14.8% in 2020 and 15.2% in 2024.
- Native Hawaiian or Other Pacific Islander workers and owners increased from 0.5% in 2016 to 0.7% in 2020 and 0.6% in 2024.

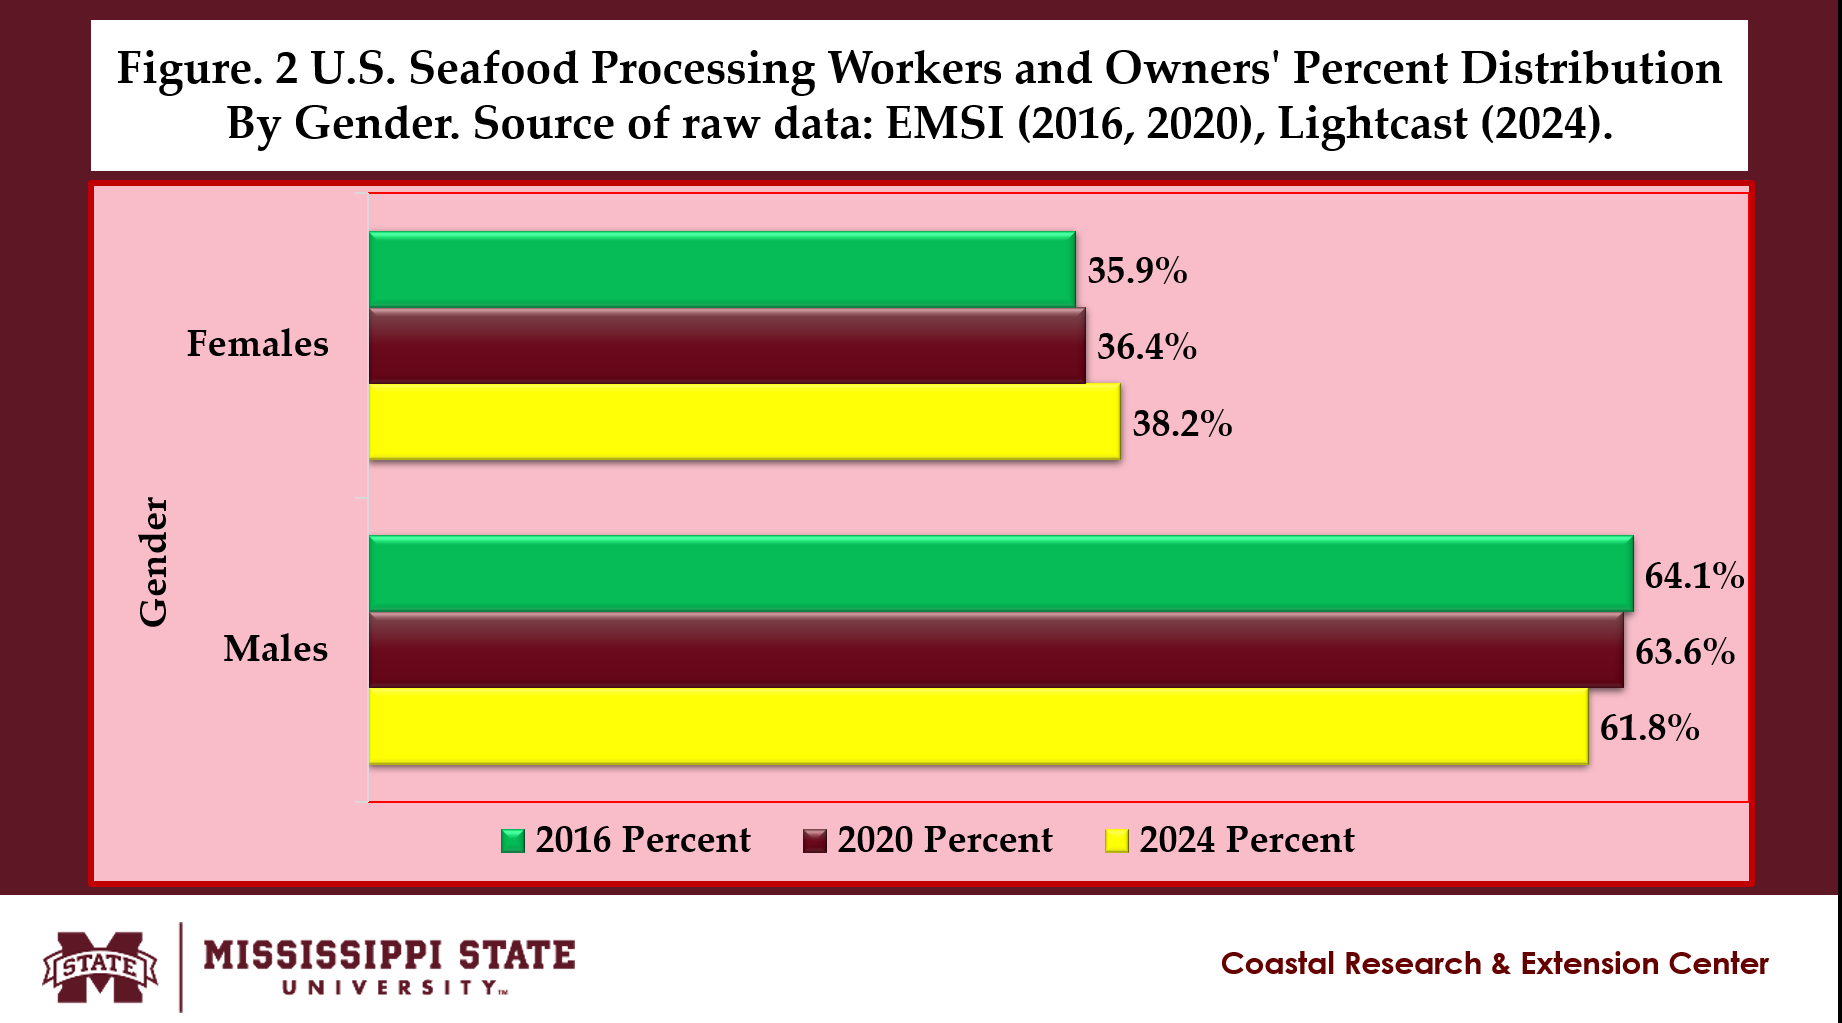
GENDER BREAKDOWN OF U.S. SEAFOOD PROCESSING WORKERS AND OWNERS
- Most U.S. seafood processing workers and owners were male from 2016 to 2024 (Fig. 2).
- Female U.S. workers and owners increased from 35.9% in 2016 to 36.4% in 2020 and 38.2% in 2024.
- Conversely, male U.S. workers and owners decreased from 64.1% in 2016 to 63.6% in 2020 and 61.8% in 2024.
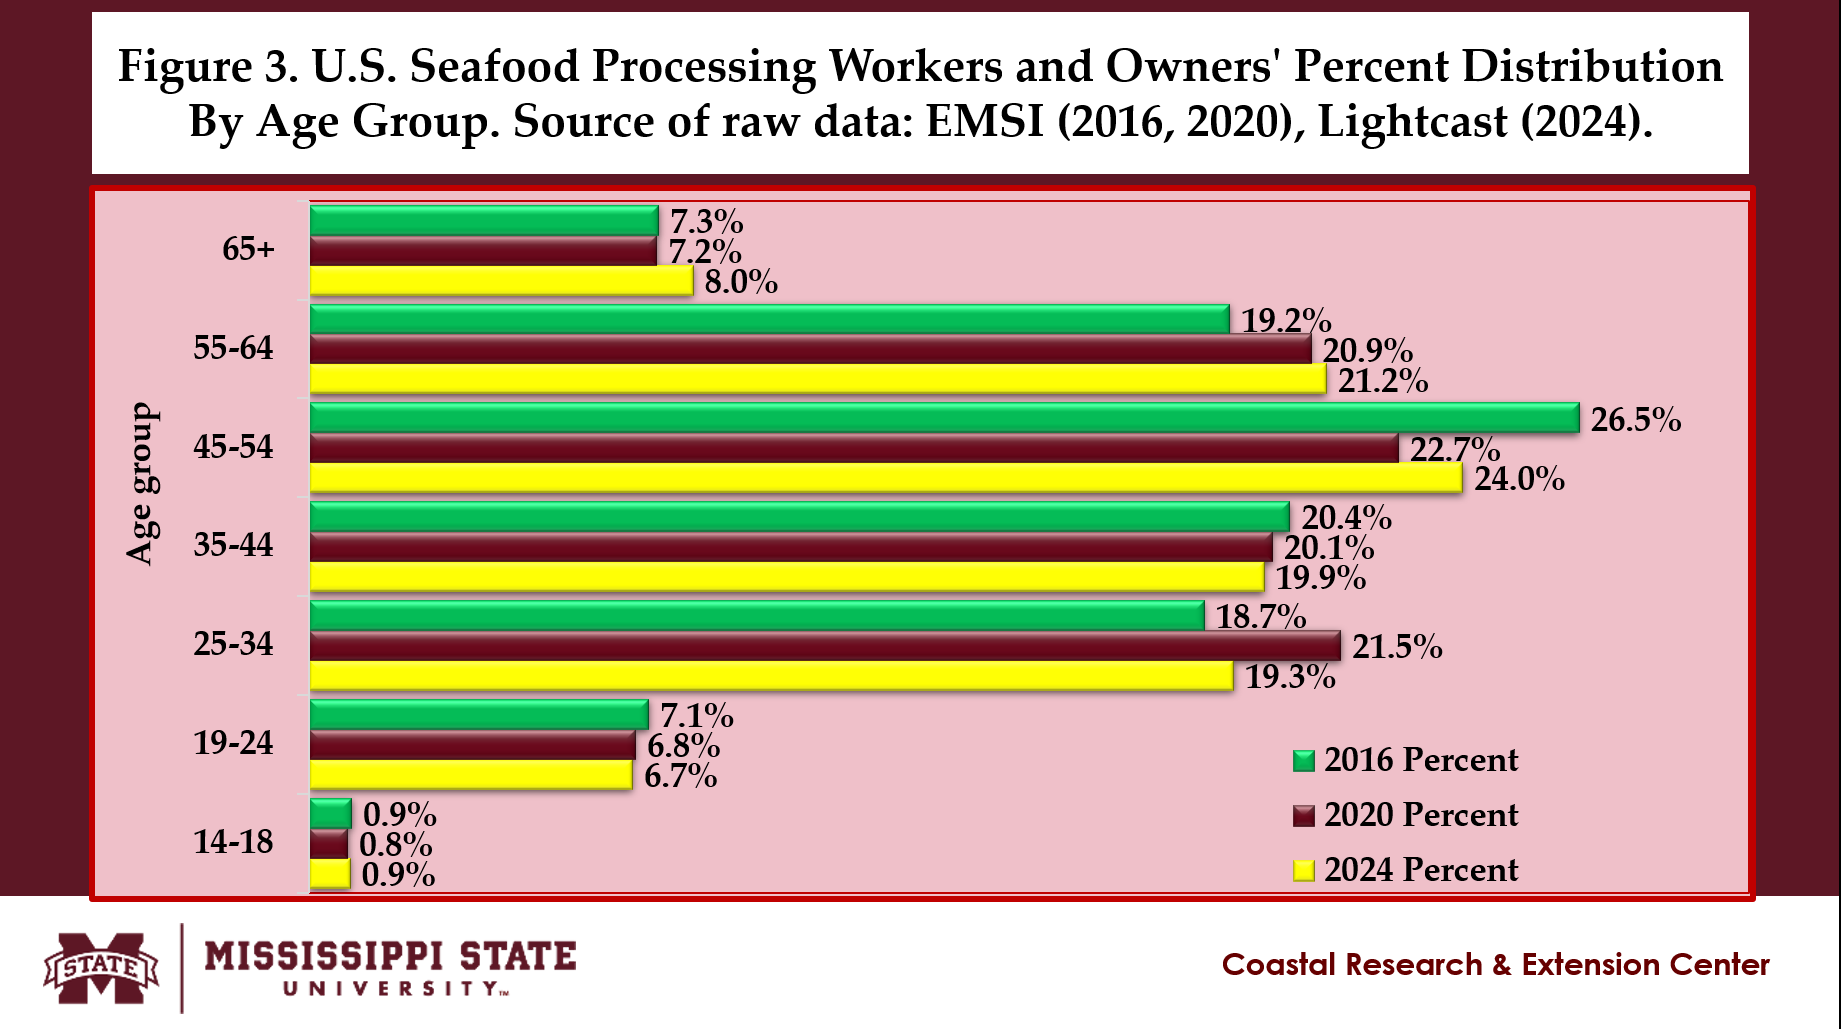
AGE BREAKDOWN U.S. SEAFOOD PROCESSING WORKERS AND OWNERS
- The 14-18-year-old workers and owners remained steady at 0.9% in 2016, 0.8% in 2020, and 0.9% in 2024 (Fig. 3).
- The 19-24-year-old workers and owners fell from 7.1% in 2016 to 6.8% in 2020 and 6.7% in 2024.
- The 25-34-year-old workers and owners rose from 18.7% in 2016 to 21.5% in 2020 but fell to 19.3% in 2024.
- The 35-44-year-old workers and owners fell from 20.4% in 2016 to 20.1% in 2020 and 19.9% in 2024.
- The 45-54-year-old workers and owners fell from 26.5% in 2016 to 22.7% in 2020 but rose to 24.0% in 2024.
- The 55-64-year-old workers and owners rose from 19.2% in 2016 to 20.9% in 2020 and 21.2% in 2024.
- The percentage of workers and owners who are 65 years old and above fell from 7.3% in 2016 to 7.2% in 2020 but rose to 8.0% in 2024.
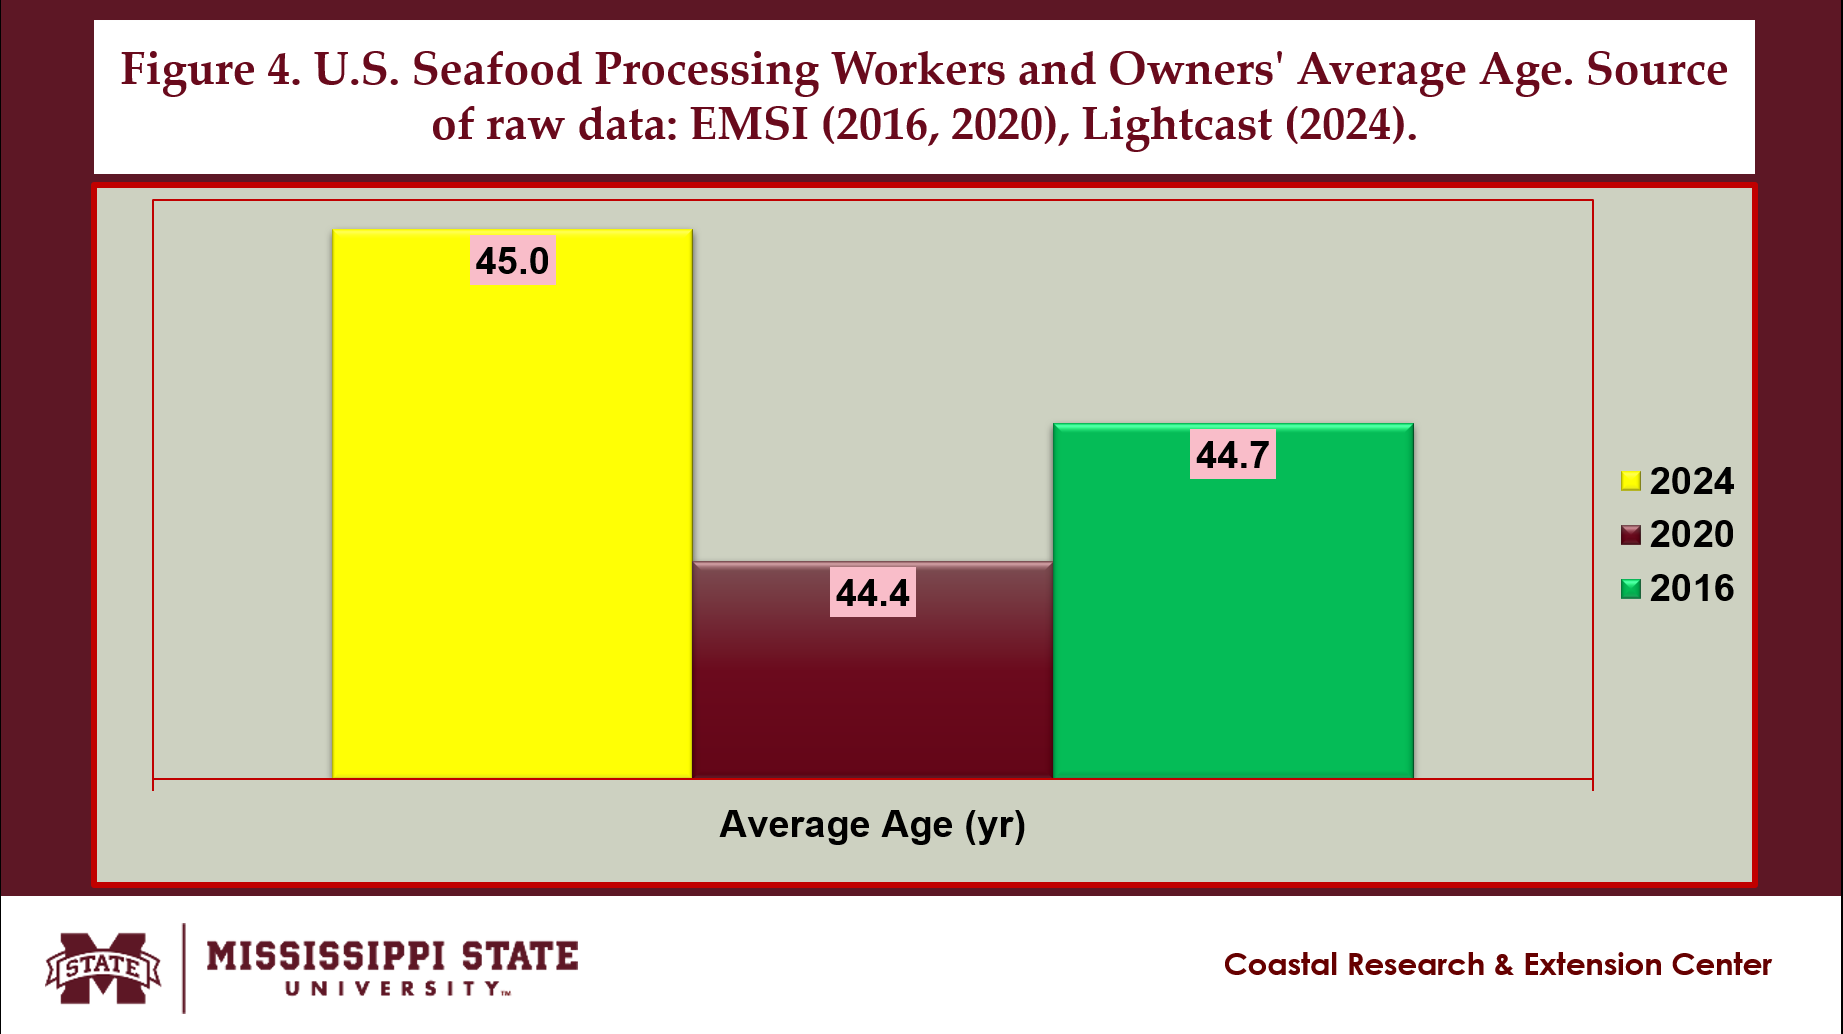
- The average age of workers and owners was 44.7 in 2016, 44.4 in 2020, and 45.0 in 2024 (Fig. 4).
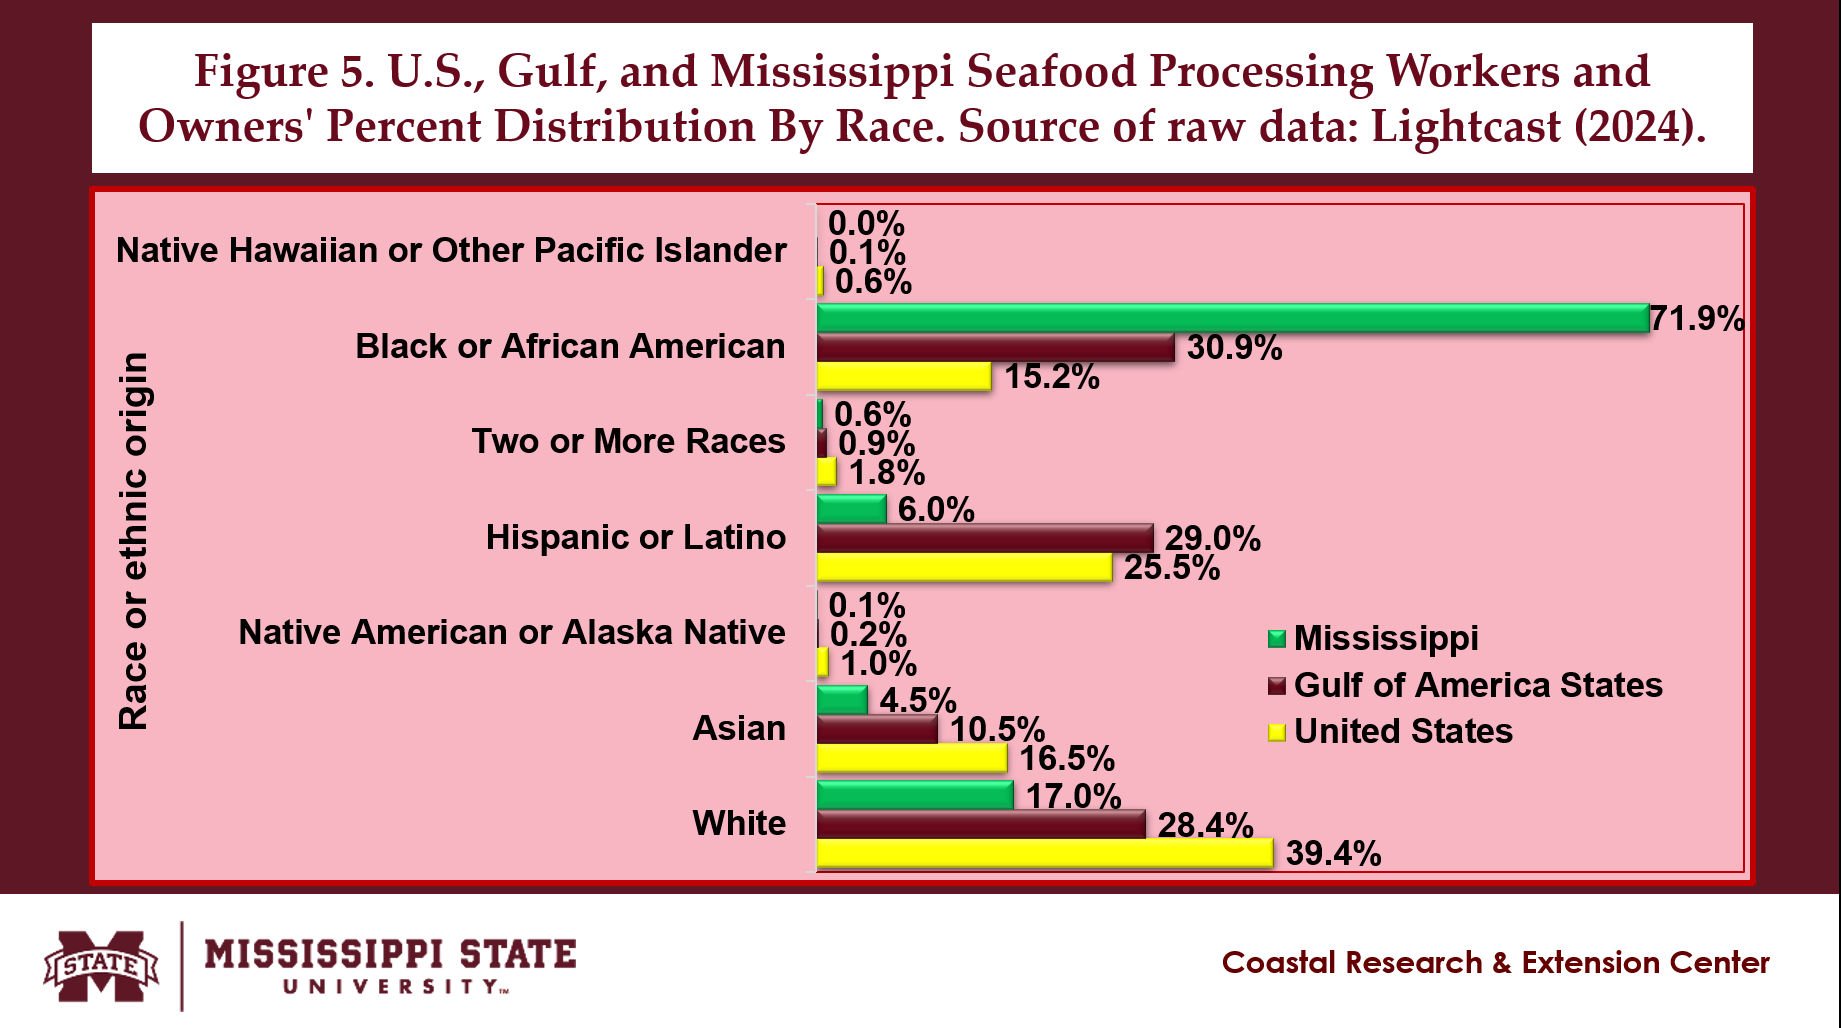
RACIAL OR ETHNICITY BREAKDOWN OF U.S., GULF STATES, AND MISSISSIPPI SEAFOOD PROCESSING WORKERS AND OWNERS
- As shown in Fig. 5, in the United States seafood processing sector, the majority of workers and owners identified as White (39.4%), followed by Hispanic or Latino (25.5%), Asian (16.5%), and Black or African American (15.2%).
- In the Gulf States seafood processing industry, the predominant demographics were Black or African American (30.9%), Hispanic or Latino (29.0%), White (28.4%), and Asian (10.5%).
- In Mississippi’s seafood processing workforce, the largest group consisted of Black or African American individuals (71.9%), with White (17.0%), Hispanic or Latino (6.0%), and Asian (4.5%).
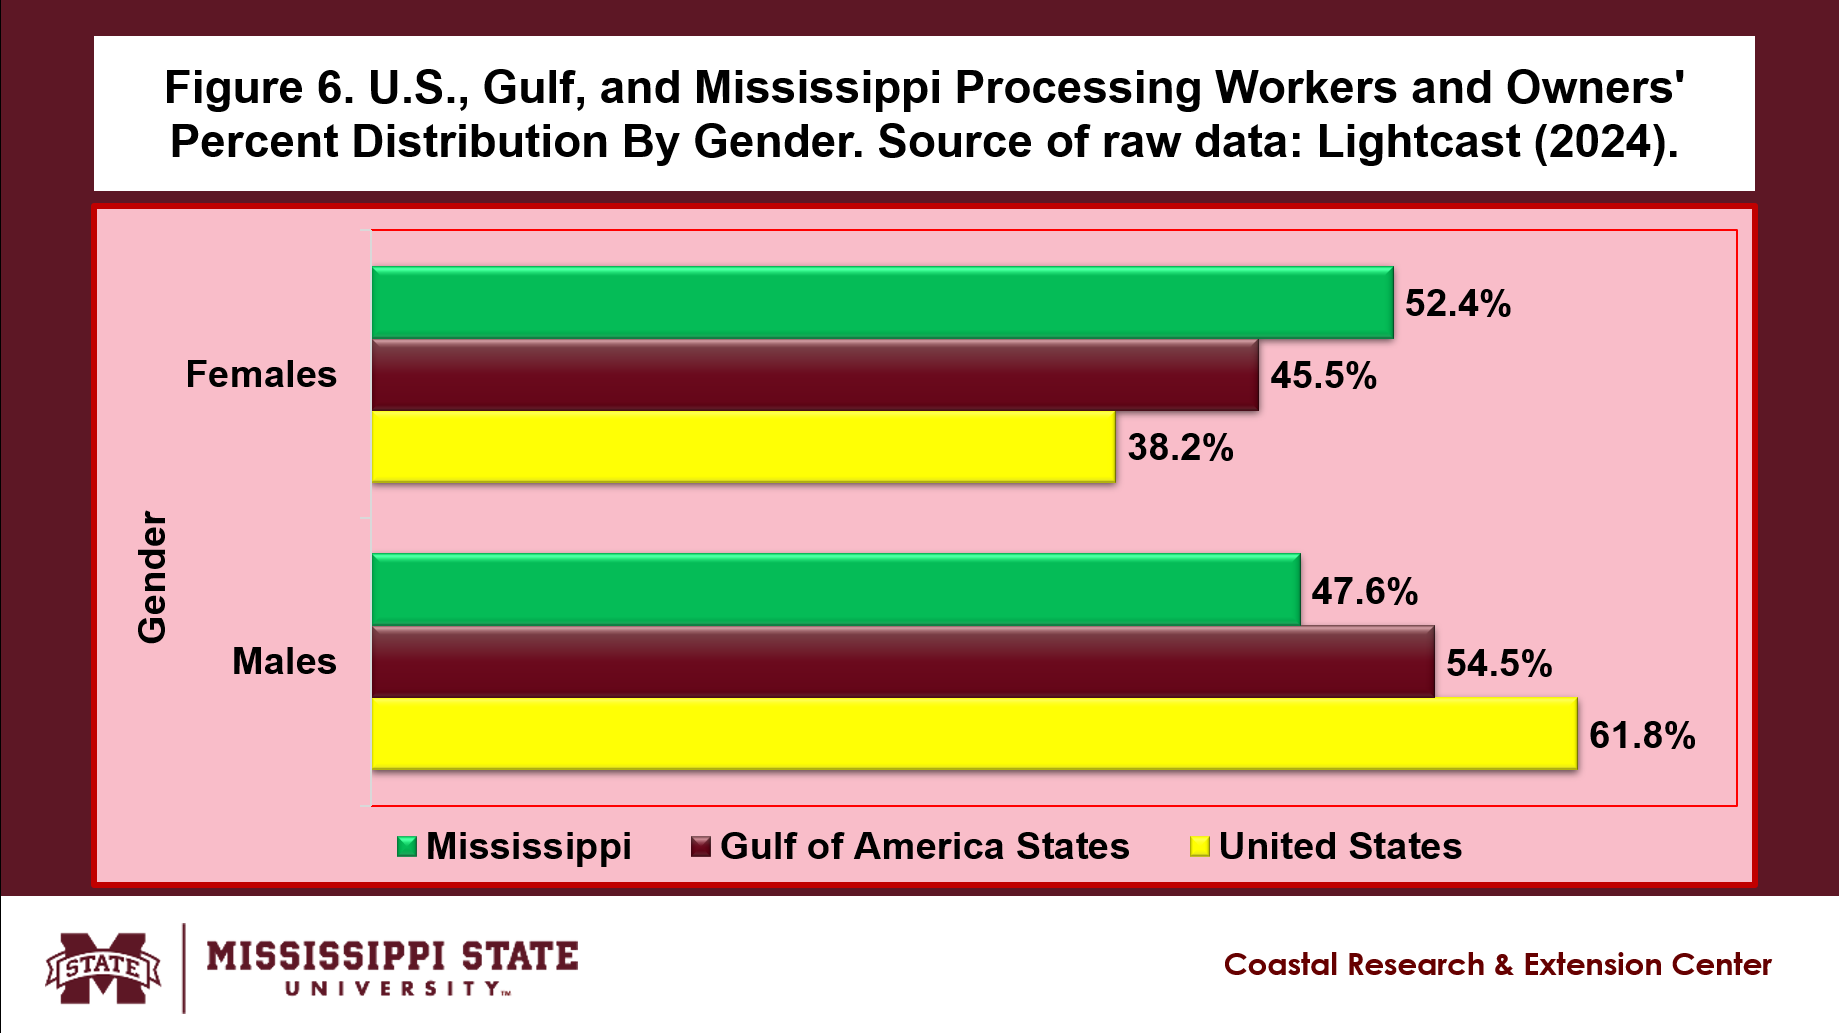
GENDER BREAKDOWN OF U.S., GULF STATES, AND MISSISSIPPI SEAFOOD PROCESSING WORKERS AND OWNERS
- In 2024, as shown in Fig. 6, most seafood processing workers and owners were males in the U.S. (61.8%) and the Gulf region (54.5%).
- In the same year, however, more female seafood processing workers and owners were reported in Mississippi (52.4%),
AGE BREAKDOWN OF THE U.S, GULF STATES, AND MISSISSIPPI SEAFOOD PROCESSING WORKERS AND OWNERS
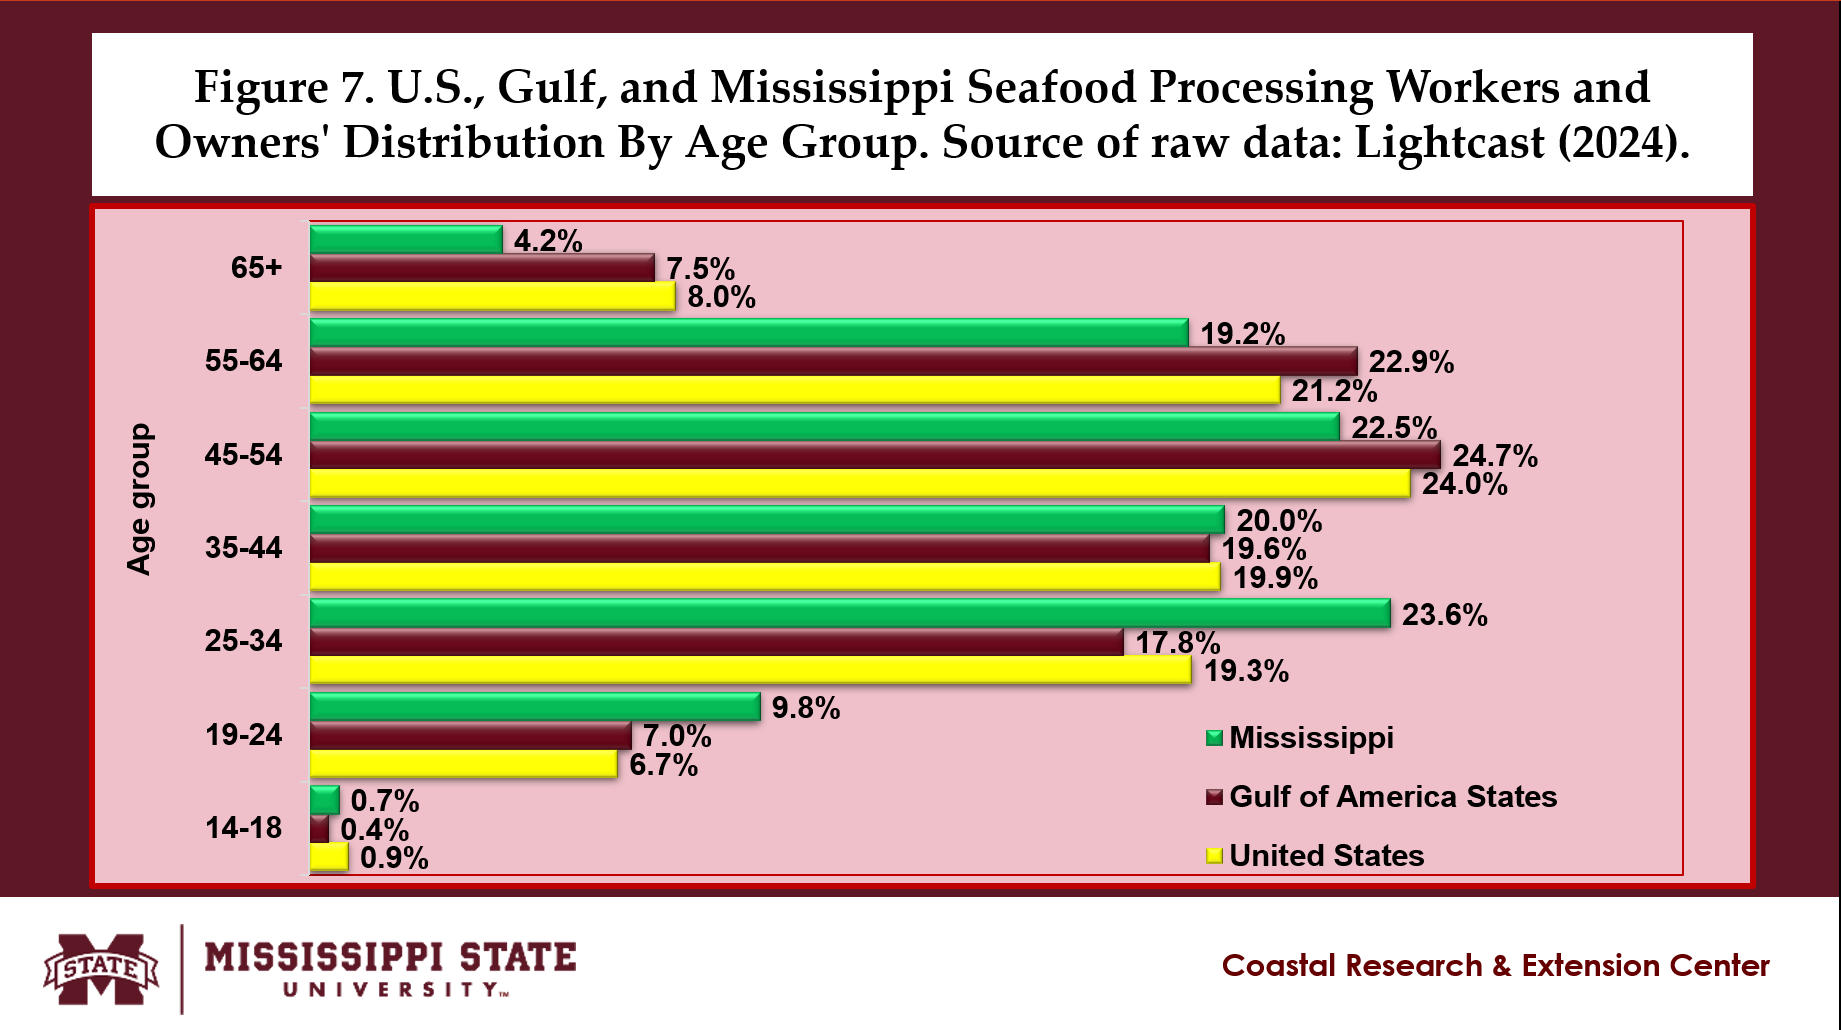
- In 2024, the percentage of older seafood processing workers and owners 55 years old and above was 29.2% in the entire U.S., 30.4% in the Gulf region, and 23.4% in Mississippi (Fig. 7).
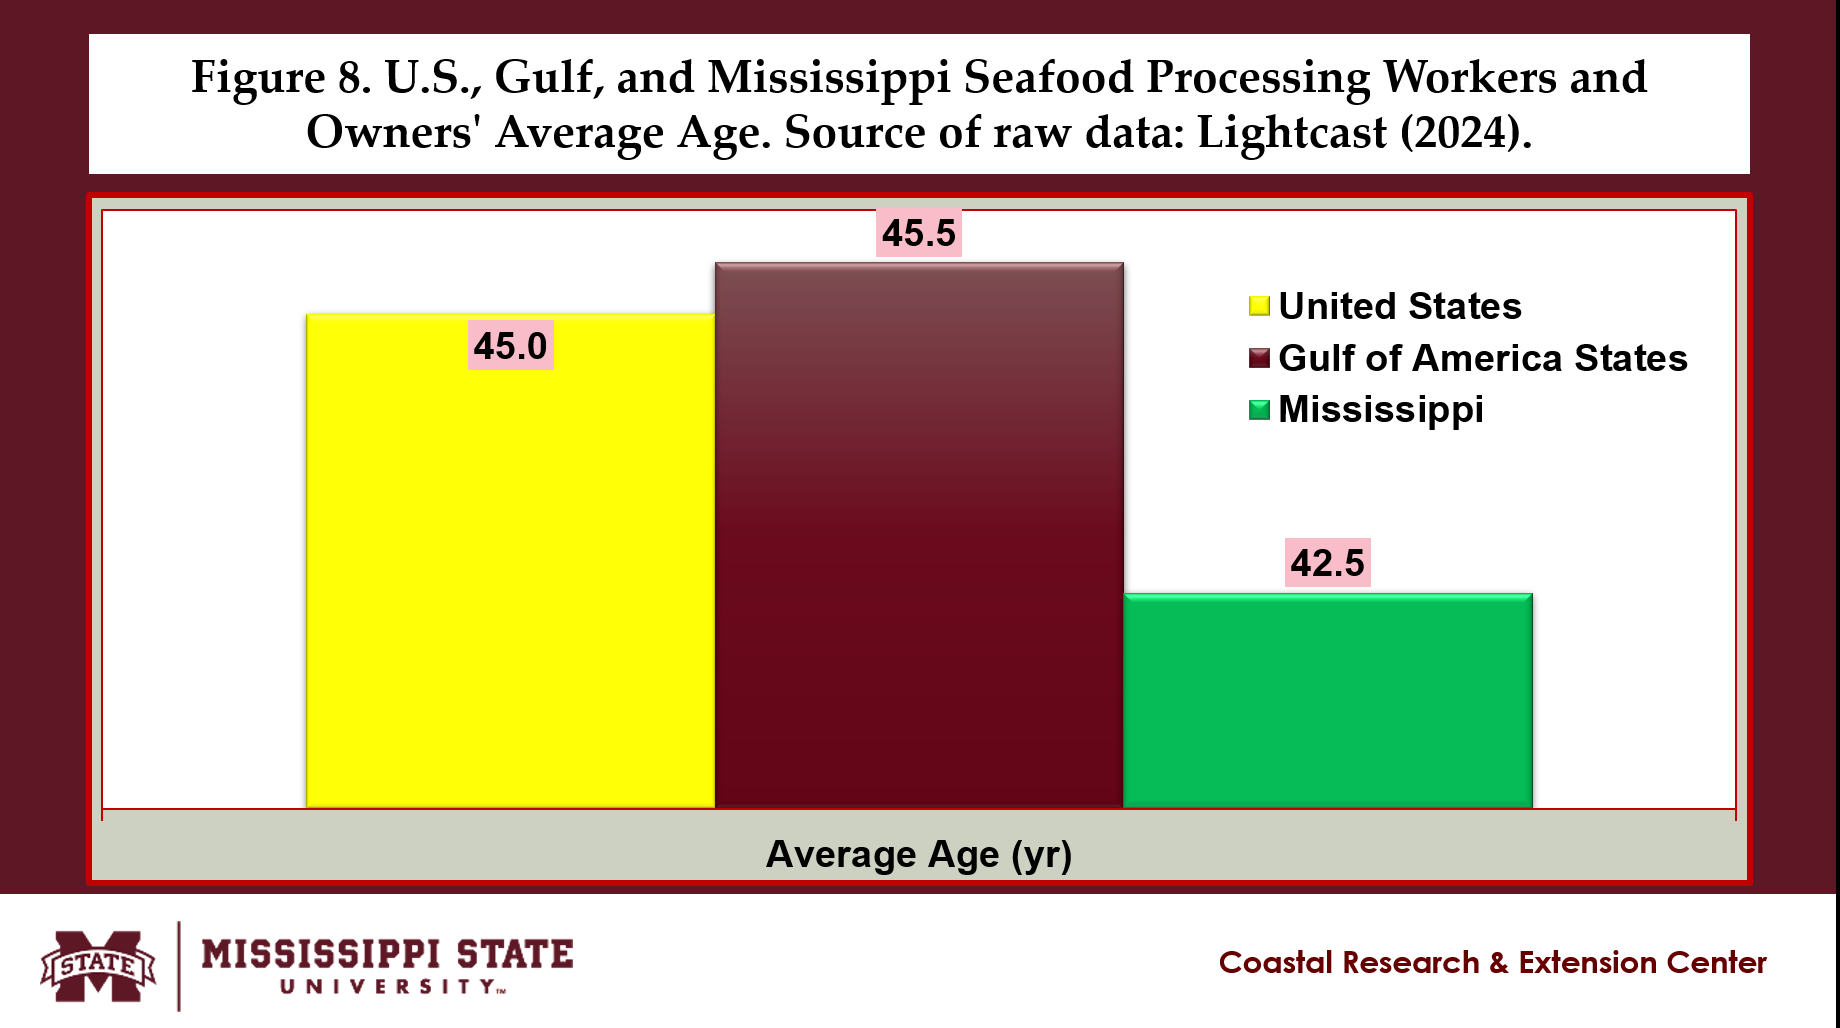
- In 2024, as shown in Fig. 8, the average age of seafood processing workers and owners was 45.0 in the entire U.S., 45.5 in the Gulf region, and 42.5 in Mississippi (Fig. 8).
SUMMARY, LIMITATIONS AND IMPLICATIONS
- This newsletter provides detailed information about the changes in the demographic profiles of seafood processing industry workers and owners in the U.S., Gulf of America region, and Mississippi.
- Demographic profiles include gender, race or ethnic origin, and age group.
- The demographic data were compiled from the EMSI website in 2016 and 2020 and the Lightcast website in 2024.
- The U.S. demographics were compiled in 2016, 2020 and 2024.
- The demographics of the entire U.S., the Gulf region, and Mississippi were compiled in 2024.
- Results indicate that the percentage of U.S. seafood processing workers and owners 65 years old and above fell from 7.3% in 2016 to 7.2% in 2020 but rose to 8.0% in 2024.
- In 2024, the percentage of seafood processing workers and owners 65-years-old and above was 8.0% in the entire U.S., 7.5% in the Gulf region, and 4.2% in Mississippi.
- The average age of U.S. seafood processing workers and owners was 44.7 in 2016, 44.4 in 2020, and 45.0 in 2024.
- In 2024, the average age of seafood processing workers and owners was 45.0 in the entire U.S., 45.5 in the Gulf region, and 42.5 in Mississippi.
- The percentage of White U.S. seafood workers and owners fell from 47.3% in 2016 to 42.4% in 2020 and 39.4% in 2024.
- In 2024, the majority of seafood processing workers and owners in the entire U.S. were White (39.4%), Black or African American (30.9%) and Hispanic and Latino (29.0%) in the Gulf region, and Black or African American (71.9%) in Mississippi.
- The percentage of male U.S. seafood processing workers and owners decreased from 64.1% in 2016 to 63.6% in 2020 and 61.8% in 2024.
- In 2024, majority of the seafood processing workers and owners were males in the entire U.S. (61.8%) and the Gulf region (54.5%) and females in Mississippi (52.4%).
ACKNOWLEDGEMENT
- This newsletter is a contribution of the Mississippi Agricultural and Forestry Experiment Station and the Mississippi State University Extension Service. This material is based upon work supported in part by the National Institute of Food and Agriculture, U.S. Department of Agriculture, Hatch project under accession number 100004. Any opinions, findings, conclusions, or recommendations expressed in this publication are those of the author. They should not be construed to represent any official USDA or U.S. Government determination or policy.
- This work was supported in part by the Mississippi-Alabama Sea Grant Consortium, National Oceanic and Atmospheric Administration, U.S. Department of Commerce, and the states of Alabama and Mississippi—federal grant number NA24OARX417C0155-T1-01. The statements, findings, conclusions, and recommendations are those of the authors and do not necessarily reflect the views of any of these funders.
SUGGESTED CITATION
- Posadas, B.C. 2025. The Demographic Profiles of U.S., Gulf States, and Mississippi Seafood Processing Workers and Owners. Vol. 15, No. 4. Mississippi State University Extension and Mississippi-Alabama Sea Grant Publication MASGP-25-058-4. March 25, 2025. https://extension.msstate.edu/newsletters/mississippi-marketmaker.