
Vol. 15, No. 2 / The Changing Demographic Profiles of U.S. Water Scenic and Sightseeing Transportation Workers and Owners
February 21, 2025
ABSTRACT
- The water scenic and sightseeing transportation industry comprises establishments primarily engaged in providing scenic and sightseeing transportation on water. The services provided are usually local and involve a same-day return to the place of origin.
- This newsletter summarizes the changes in the demographics of owners and workers of the U.S. water scenic and sightseeing transportation industry from 2017 to 2024. Demographic profiles include distribution by gender, race or ethnic origin, and age group.
- The percentage of White workers and owners rose from 74.0% in 2017 to 82.0% in 2020 but fell to 74.5% in 2024. The majority of U.S. workers and owners were male, ranging from 65.6% in 2017 to 73.9% in 2020 and 71.1% in 2024. The percentage of workers and owners 65 years old and above remained the same at 8.4% in 2017 and 2020 but rose to 9.4% in 2024. The average age of U.S. workers and owners rose from 43.0 in 2017 to 45.9 in 2020 but fell to 43.5 in 2024.
KEYWORDS
- Airboat operations, excursion boat operations, charter fishing boat services, harbor sightseeing tours, and dinner cruises.
METHODS
- NAICS sector 487210. Source: https://www.census.gov/naics/. This industry comprises establishments primarily engaged in providing scenic and sightseeing transportation on water.
- The services provided are usually local and involve same-day return to the place of origin.
- Illustrative examples are airboat (i.e., swamp buggy) operations, excursion boat operations, charter fishing boat services, harbor sightseeing tours, and dinner cruises.
- Demographic profiles include distribution by gender, race or ethnic origin, and age group.
- The demographic data were compiled from the EMSI website in 2017 and 2020 and the Lightcast website in 2024.
CHANGES IN THE PERCENTAGE OF U.S. WORKERS AND OWNERS AMONG THESE GROUPS FROM 2017 TO 2024.
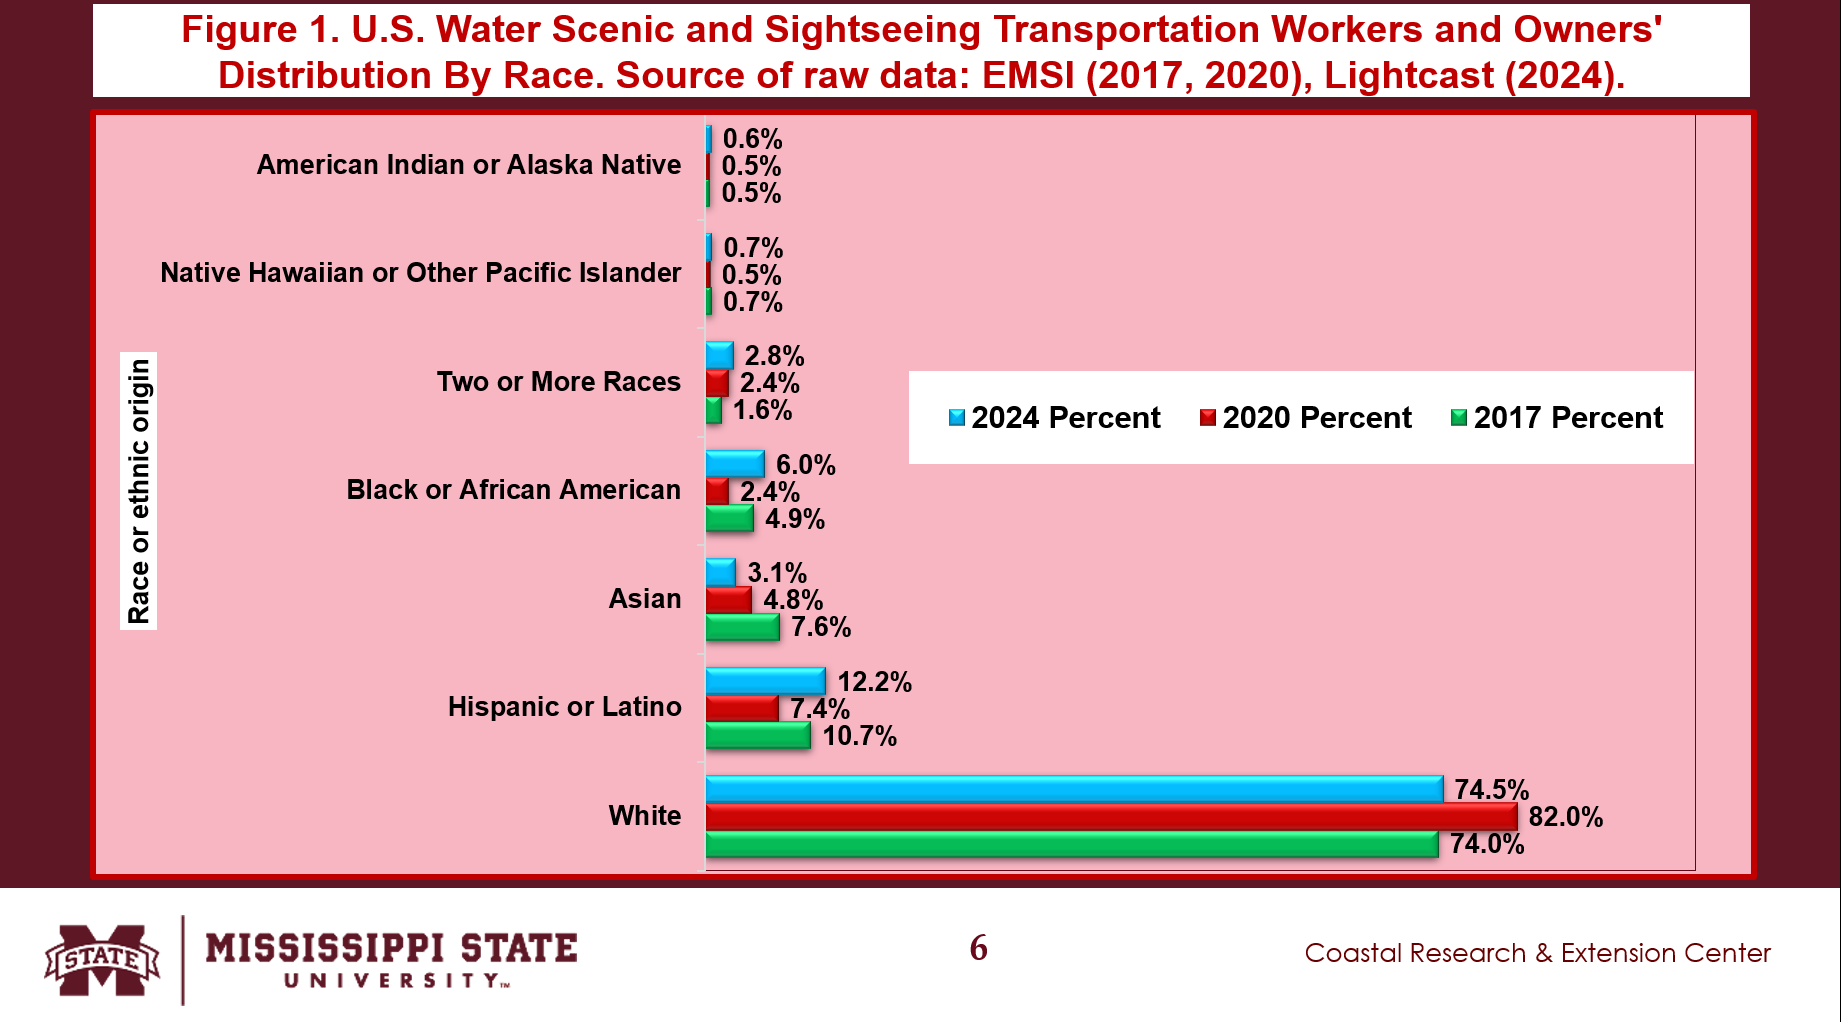
- White workers and owners rose from 74.0% in 2017 to 82.0% in 2020 but fell to 74.5% in 2024 (Fig. 1).
- Hispanic or Latino workers and owners decreased from 10.7% in 2017 to 7.4% in 2020 but rose to 12.2% in 2024.
- Black or African American workers and owners decreased from 4.9% in 2017 to 2.4% in 2020 but rose to 6.0% in 2024.
- Workers and owners who reported two or more races rose from 1.6% in 2017 to 2.4% in 2020 and 2.8% in 2024.
- Asian workers and owners decreased from 7.6% in 2017 to 4.8% in 2020 and 3.1% in 2024.
- Native Hawaiian or Other Pacific Islander workers and owners fell from 0.7% in 2017 to 0.5% in 2020 but rose to 0.7% in 2024.
- American Indian or Alaska Native workers and owners remained the same at 0.5% in 2017 and 2020 but rose to 0.6% in 2024.
OVERALL, THE PERCENTAGE OF FEMALE U.S. WORKERS AND OWNERS DECREASED FROM 2017 TO 2024.
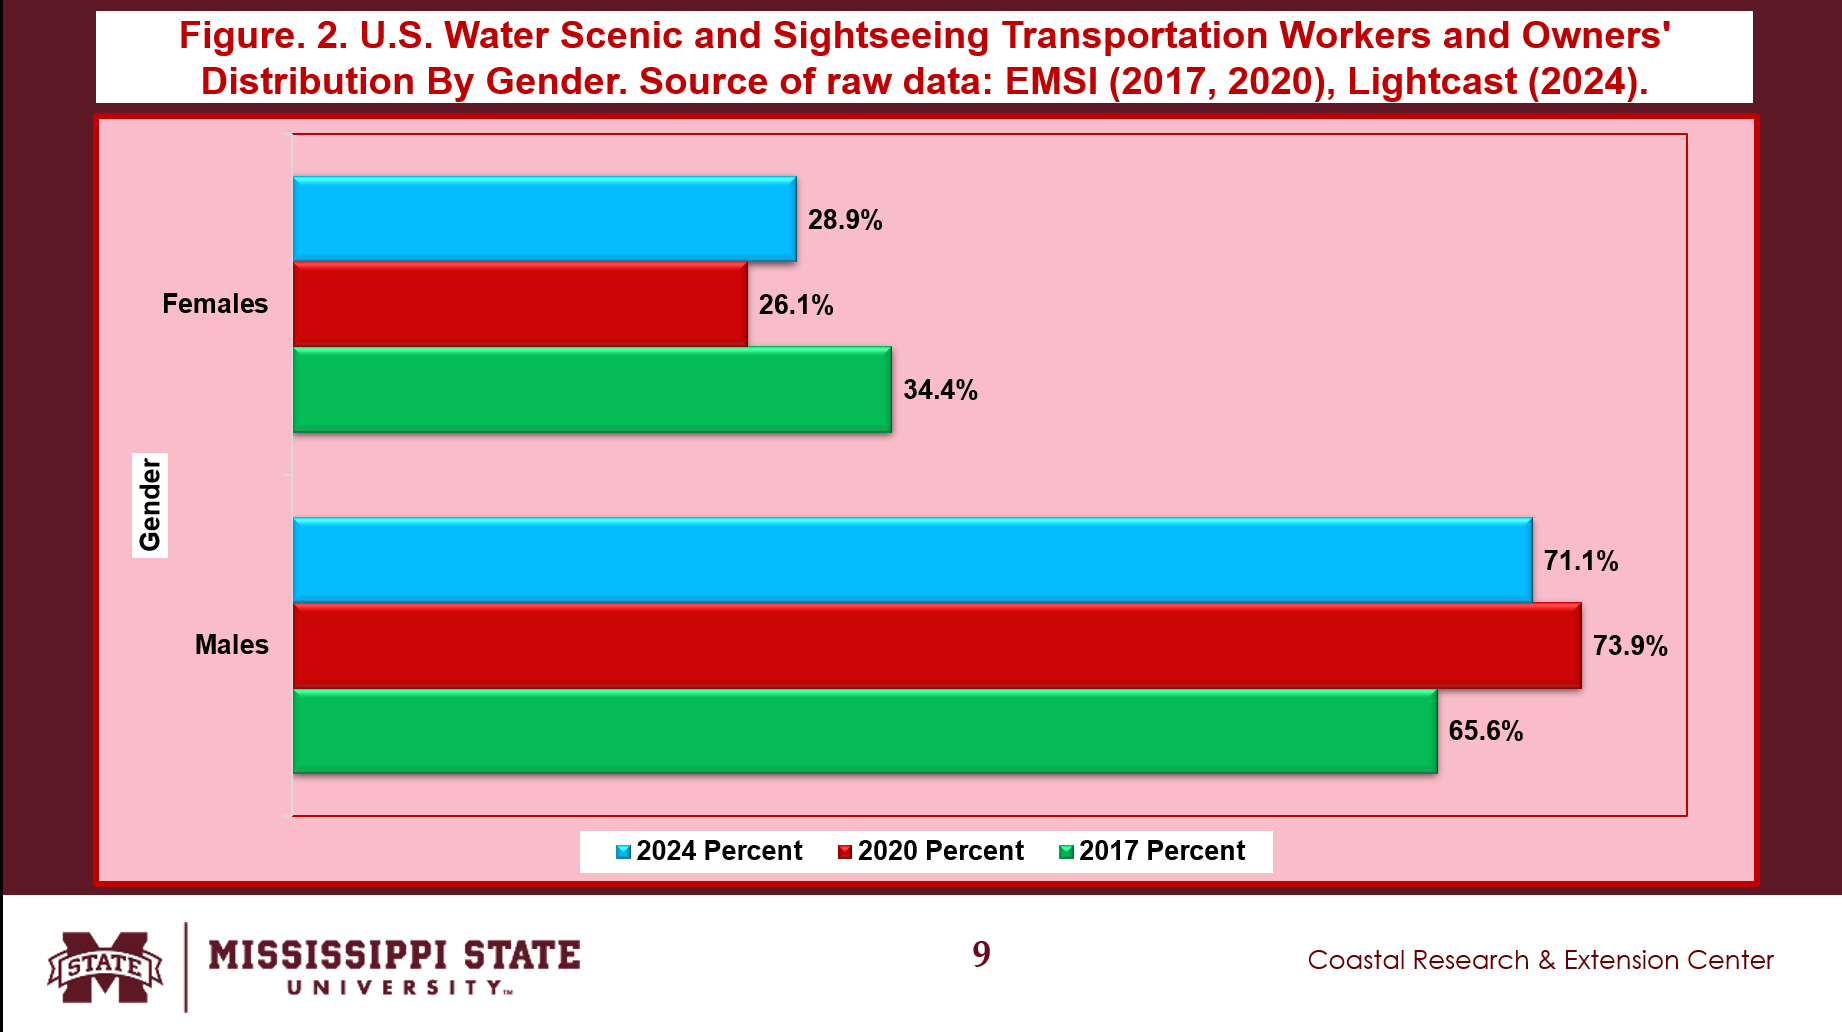
- Female U.S. workers and owners among these groups decreased from 34.4% in 2017 to 26.1% in 2020 (Fig. 2).
- However, female U.S. workers and owners increased from 26.1% in 2020 to 28.9% in 2024.
- Majority of U.S. workers and owners were male, ranging from 65.6% in 2017 to 73.9% in 2020 and 71.1% in 2024.
CHANGES IN U.S. WORKERS AND OWNERS AMONG AGE GROUPS FROM 2017 TO 2024.
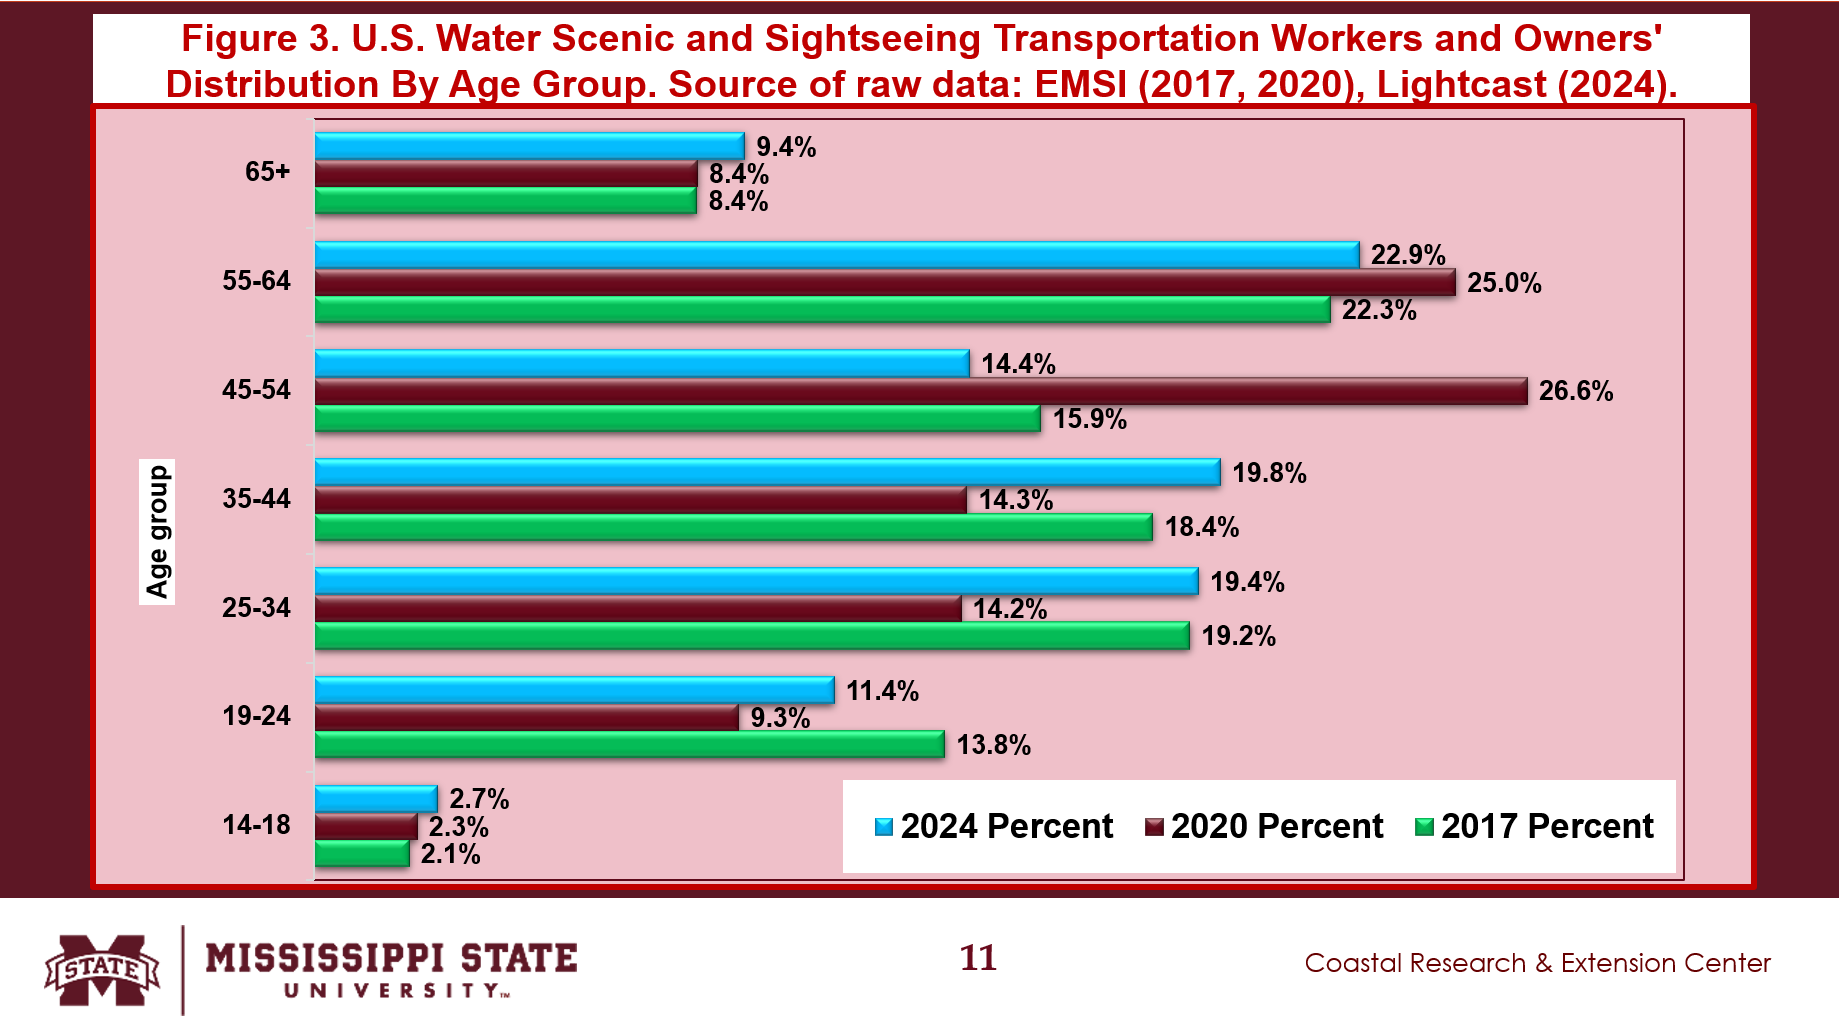
- The 14-18-year-old workers and owners rose from 2.1% in 2017 to 2.3% in 2020 and 2.7% in 2024 (Fig. 3).
- The 19-24-year-old workers and owners fell from 13.8% in 2017 to 9.3% in 2020 but rose to 11.4% in 2024.
- The 25-34-year-old workers and owners fell from 19.2% in 2017 to 14.2% in 2020 but rose to 19.4% in 2024.
- The 35-44-year-old workers and owners fell from 18.4% in 2017 to 14.3% in 2020 but rose to 19.8% in 2024.
- The 45-54-year-old workers and owners rose from 15.9% in 2017 to 26.6% in 2020 but fell to 14.4% in 2024.
- The 55-64-year-old workers and owners rose from 22.3% in 2017 to 25.0% in 2020 but fell to 22.9% in 2024.
- The percentage of workers and owners 65 years old and above remained the same at 8.4% in 2017 and 2020 but rose to 9.4% in 2024.
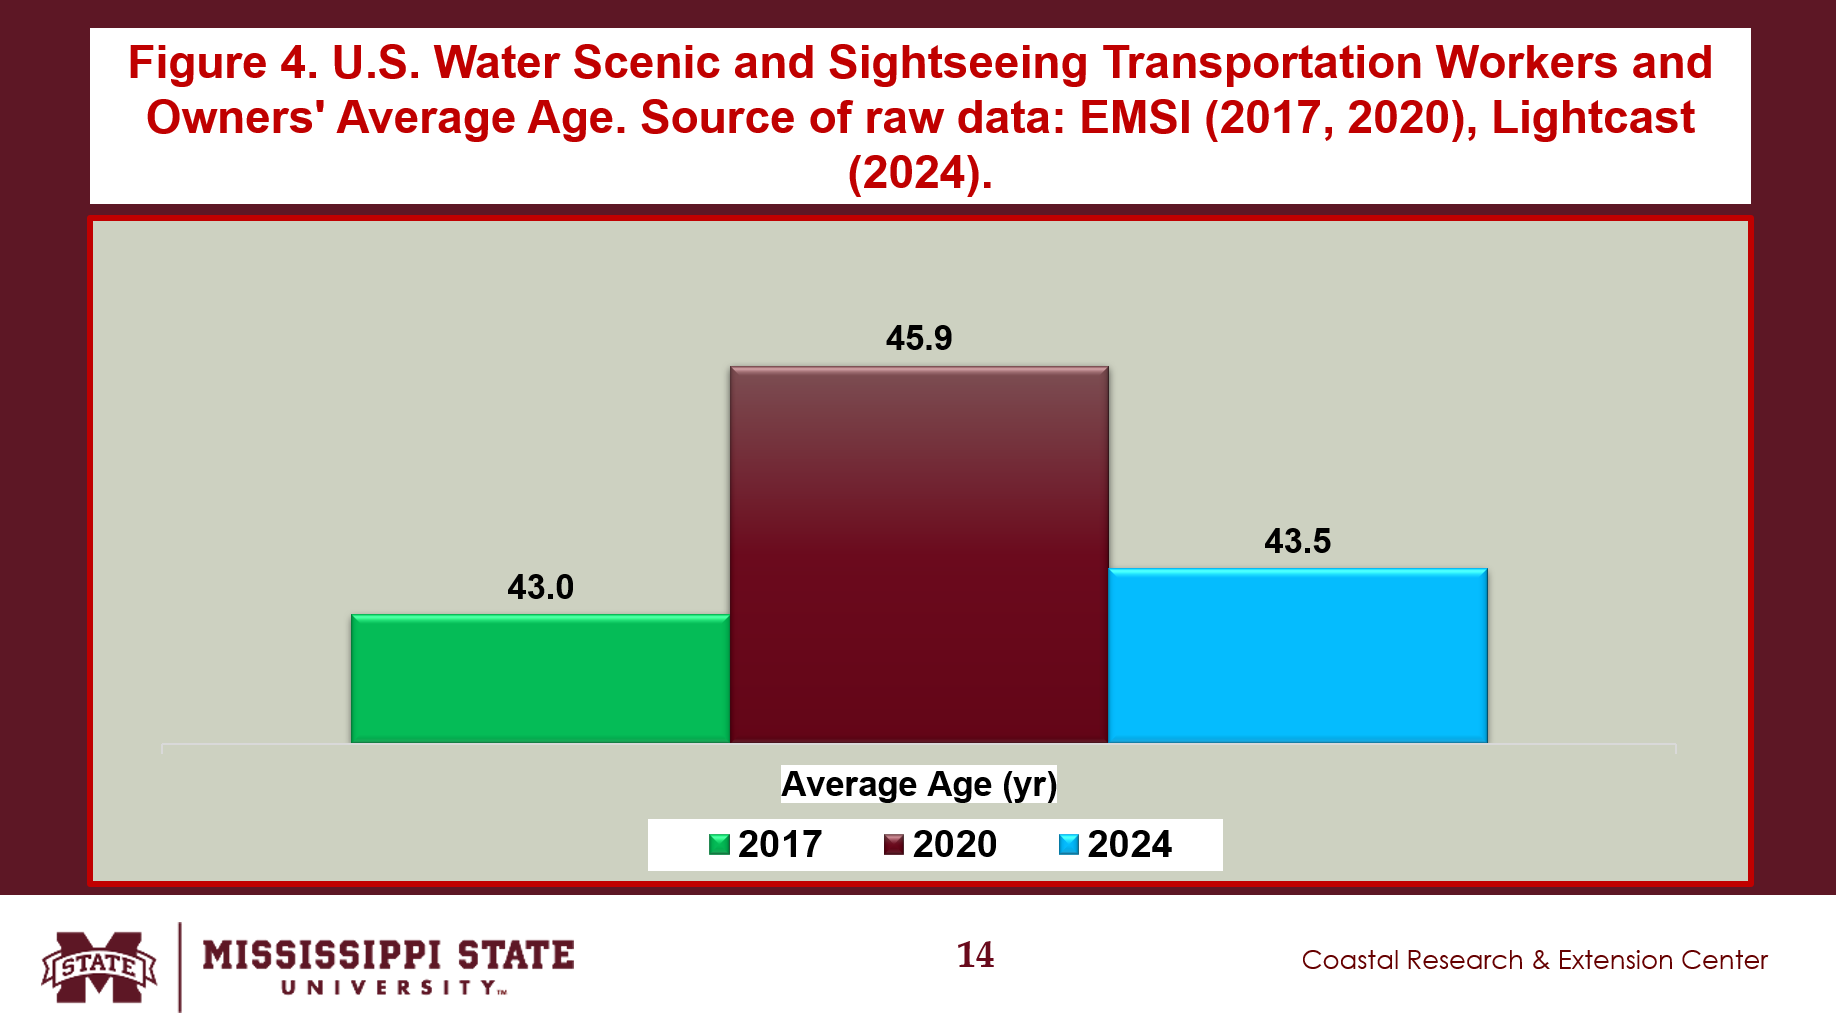
CHANGES IN U.S. WORKERS AND OWNERS’ AVERAGE AGE FROM 2017 TO 2024.
- The average age of U.S. workers and owners rose from 43.0 in 2017 to 45.9 in 2020 but fell to 43.5 in 2024 (Fig. 4).
SUMMARY, LIMITATIONS, AND IMPLICATIONS
- This presentation provides detailed information about the changes in the demographic profiles of the water scenic and sightseeing transportation industry.
- Demographic profiles include covered gender, race or ethnic origin, and age group.
- The demographic data were compiled from the EMSI website in 2017 and 2020 and the Lightcast website in 2024.
- Results indicate that the percentage of workers and owners 65 years old and above remained the same at 8.4% in 2017 and 2020 but rose to 9.4% in 2024.
- White workers and owners rose from 74.0% in 2017 to 82.0% in 2020 but fell to 74.5% in 2024.
- The average age of U.S. workers and owners rose from 43.0 in 2017 to 45.9 in 2020 but fell to 43.5 in 2024.
- Majority of U.S. workers and owners were male, ranging from 65.6% in 2017 to 73.9% in 2020 and 71.1% in 2024.
ACKNOWLEDGEMENT
- This newsletter is a contribution of the Mississippi Agricultural and Forestry Experiment Station and the Mississippi State University Extension Service. This material is based upon work that is supported in part by the National Institute of Food and Agriculture, U.S. Department of Agriculture, Hatch project under accession number 100004, and
- This work was supported in part by the Mississippi-Alabama Sea Grant Consortium, National Oceanic and Atmospheric Administration, U.S. Department of Commerce, and the states of Alabama and Mississippi—federal grant number NA24OARX417C0155-T1-01. The statements, findings, conclusions, and recommendations are those of the authors and do not necessarily reflect the views of any of these funders.
- This newsletter is a Mississippi-Alabama Sea Grant Publication MASGP-25-058-02.
SUGGESTED CITATION
- Posadas, B.C. 2025. The Changing Demographic Profiles of U.S. Water Scenic and Sightseeing Transportation Workers and Owners. Vol. 15, No. 2. Mississippi State University Extension and Mississippi-Alabama Sea Grant Publication MASGP-25-058-2. February 19, 2025. https://extension.msstate.edu/newsletters/mississippi-marketmaker.